The Phillips curve in the Keynesian perspective
Key points
-
A Phillips curve shows the tradeoff between unemployment and inflation in an economy.
-
Keynesian macroeconomics argues that the solution to a recession is expansionary fiscal policy that shifts the aggregate demand curve to the right.
-
The other side of Keynesian policy occurs when the economy is operating above potential GDP. In this situation, unemployment is low, but inflationary rises in the price level are a concern. The Keynesian response would be contractionary fiscal policy that shifts aggregate demand to the left.
-
Contractionary fiscal policy consists of tax increases or cuts in government spending designed to decrease aggregate demand and reduce inflationary pressures.
-
Expansionary fiscal policy consists of tax cuts or increases in government spending designed to stimulate aggregate demand and move the economy out of recession.
The discovery of the Phillips curve
In the 1950s, A.W. Phillips, an economist at the London School of Economics, was studying the Keynesian analytical framework. The Keynesian theory implied that during a recession inflationary pressures are low, but when the level of output is at or even pushing beyond potential gross domestic product, or GDP, the economy is at greater risk for inflation.
Phillips analyzed 60 years of British data and found the tradeoff between unemployment and inflation described in Keynesian theory, which became known as a Phillips curve.
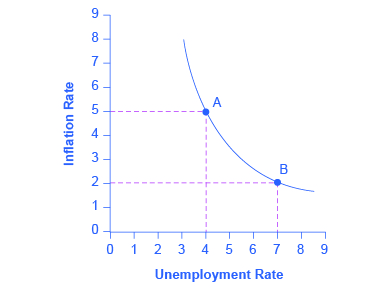
The graph provides a visual representation of the Phillips curve with a downward-sloping curve.
Image credit: Figure 2 in "The Phillips Curve" by OpenStaxCollege, CC BY 4.0
Where does the Phillips curve come from?
The simplified aggregate demand/aggregate supply, or AD/AS, model that we have used so far in this tutorial is fully consistent with Keynes’s original model. More recent research, though, has indicated that in the real world, an AS curve is more curved than the right angle we've used up until this point. The real-world AS curve is very flat at levels of output far below potential—the Keynesian zone—very steep at levels of output above potential—the neoclassical zone—and curved in between—the intermediate zone. You can see these zones indicated in the diagram below.
The typical aggregate supply curve leads to the concept of the Phillips curve.
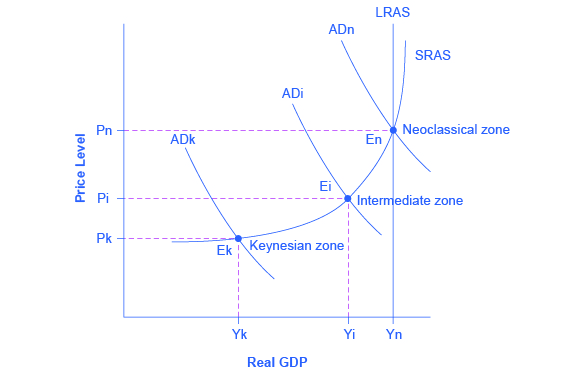
The graph shows three aggregate demand curves to represent different zones: the Keynesian zone, the intermediate zone, and the neoclassical zone. The Keynesian zone is farthest to the left as well as the lowest; the intermediate zone is the center of the three curves; the neoclassical is farthest to the right as well as the highest.
Image credit: Figure 1 in "The Phillips Curve" by OpenStaxCollege, CC BY 4.0
The instability of the Phillips curve
During the 1960s, the Phillips curve was seen as a policy menu. A nation could choose low inflation and high unemployment, or high inflation and low unemployment, or anywhere in between. Fiscal and monetary policy could be used to move up or down the Phillips curve as desired.
Then a curious thing happened. When policymakers tried to exploit the tradeoff between inflation and unemployment, the result was an increase in both inflation and unemployment. What had happened? The Phillips curve shifted.
The US economy experienced this pattern in the deep recession from 1973 to 1975 and again in back-to-back recessions from 1980 to 1982. Many nations around the world saw similar increases in unemployment and inflation. This pattern became known as stagflation—an unhealthy combination of high unemployment and high inflation. Perhaps most important, stagflation was a phenomenon that could not be explained by traditional Keynesian economics.
Economists have concluded that two factors cause the Phillips curve to shift. The first is supply shocks, like the oil crisis of the mid-1970s, which first brought stagflation into our vocabulary. The second is changes in people’s expectations about inflation.
In other words, there may be a tradeoff between inflation and unemployment when people expect no inflation, but when they realize inflation is occurring, the tradeoff disappears. Both factors—supply shocks and changes in inflationary expectations—cause the aggregate supply curve, and thus the Phillips curve, to shift.
In short, a downward-sloping Phillips curve should be interpreted as valid for short-run periods of several years, but over longer periods—when aggregate supply shifts—the downward-sloping Phillips curve can shift so that unemployment and inflation are both higher—as happened in the 1970s and early 1980s—or both lower—as happened in the early 1990s or first decade of the 2000s.
Keynesian policy for fighting unemployment and inflation
Keynesian macroeconomics argues that the solution to a recession is expansionary fiscal policy, such as tax cuts to stimulate consumption and investment or direct increases in government spending that would shift the aggregate demand curve to the right.
For example, in the diagram below, if aggregate demand were originally at start text, A, D, r, end text, showing that the economy was in recession, the appropriate policy would be for government to shift aggregate demand to the right from start text, A, D, r, end text to start text, A, D, f, end text, where the economy would be at potential GDP and full employment.
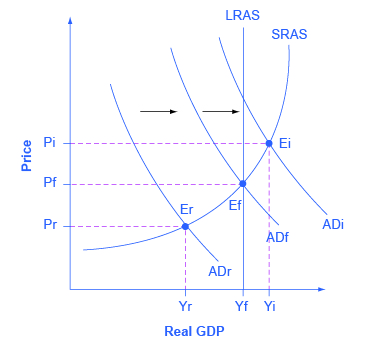
The graph shows three possible downward-sloping AD curves, an upward-sloping AS curve, and a vertical, straight potential GDP line.
Image credit: Figure 5 in "The Phillips Curve" by OpenStaxCollege, CC BY 4.0
Keynes argued that while it would be nice if the government could spend additional money on housing, roads, and other amenities, if the government could not agree on how to spend money in practical ways, then it could spend in impractical ways. For example, Keynes suggested building monuments, like a modern equivalent of the Egyptian pyramids. He proposed that the government could bury money underground and let mining companies dig the money up again.
These suggestions were slightly tongue-in-cheek, but their purpose was to emphasize that a Great Depression is no time to quibble over the specifics of government spending programs and tax cuts when the goal should be to pump up aggregate demand by enough to lift the economy to potential GDP.
The other side of Keynesian policy occurs when the economy is operating above potential GDP. In this situation, unemployment is low, but inflationary rises in the price level are a concern. The Keynesian response would be contractionary fiscal policy, using tax increases or government spending cuts to shift AD to the left. The result would be downward pressure on the price level, but very little reduction in output or very little rise in unemployment.
For example, in the diagram above, If aggregate demand were originally at start text, A, D, i, end text, showing that the economy was experiencing inflationary rises in the price level, the appropriate policy would be for government to shift aggregate demand to the left, from start text, A, D, i, end text toward start text, A, D, f, end text, which would reduce the pressure for a higher price level while the economy remains at full employment.
In the Keynesian economic model, too little aggregate demand brings unemployment and too much brings inflation. Thus, you can think of Keynesian economics as pursuing a “Goldilocks” level of aggregate demand: not too much, not too little, but what is just right.
Summary
-
A Phillips curve shows the tradeoff between unemployment and inflation in an economy.
-
Keynesian macroeconomics argues that the solution to a recession is expansionary fiscal policy that shifts the aggregate demand curve to the right.
-
The other side of Keynesian policy occurs when the economy is operating above potential GDP. In this situation, unemployment is low, but inflationary rises in the price level are a concern. The Keynesian response would be contractionary fiscal policy that shifts aggregate demand to the left.
-
Contractionary fiscal policy consists of tax increases or cuts in government spending designed to decrease aggregate demand and reduce inflationary pressures.
-
Expansionary fiscal policy consists of tax cuts or increases in government spending designed to stimulate aggregate demand and move the economy out of recession.
- Arts
- Business
- Computers
- Games
- Health
- Home
- Kids and Teens
- Money
- News
- Personal Development
- Recreation
- Regional
- Reference
- Science
- Shopping
- Society
- Sports
- Бизнес
- Деньги
- Дом
- Досуг
- Здоровье
- Игры
- Искусство
- Источники информации
- Компьютеры
- Личное развитие
- Наука
- Новости и СМИ
- Общество
- Покупки
- Спорт
- Страны и регионы
- World
