What Metrics / KPIs Should Be Used in Mobile Marketing?
Introduction
In the rapidly evolving world of mobile marketing, success isn’t just about launching creative campaigns or driving downloads — it’s about measuring impact intelligently. Mobile users behave differently from desktop users; they interact on smaller screens, make quicker decisions, and expect highly personalized experiences. To understand whether your mobile marketing efforts are effective, you need the right metrics and Key Performance Indicators (KPIs).
Without the right measurements, even the most sophisticated campaigns can fail to achieve business objectives. Metrics give clarity — they reveal what’s working, what isn’t, and how to optimize for better results. Whether you’re focused on SMS marketing, app installs, in-app engagement, push notifications, mobile web ads, or geofencing, KPIs serve as the compass guiding strategic adjustments and resource allocation.
This article provides a comprehensive breakdown of the most important mobile marketing metrics, explains how to interpret them, and offers strategies for aligning them with your business goals.
1. Understanding Mobile Marketing KPIs
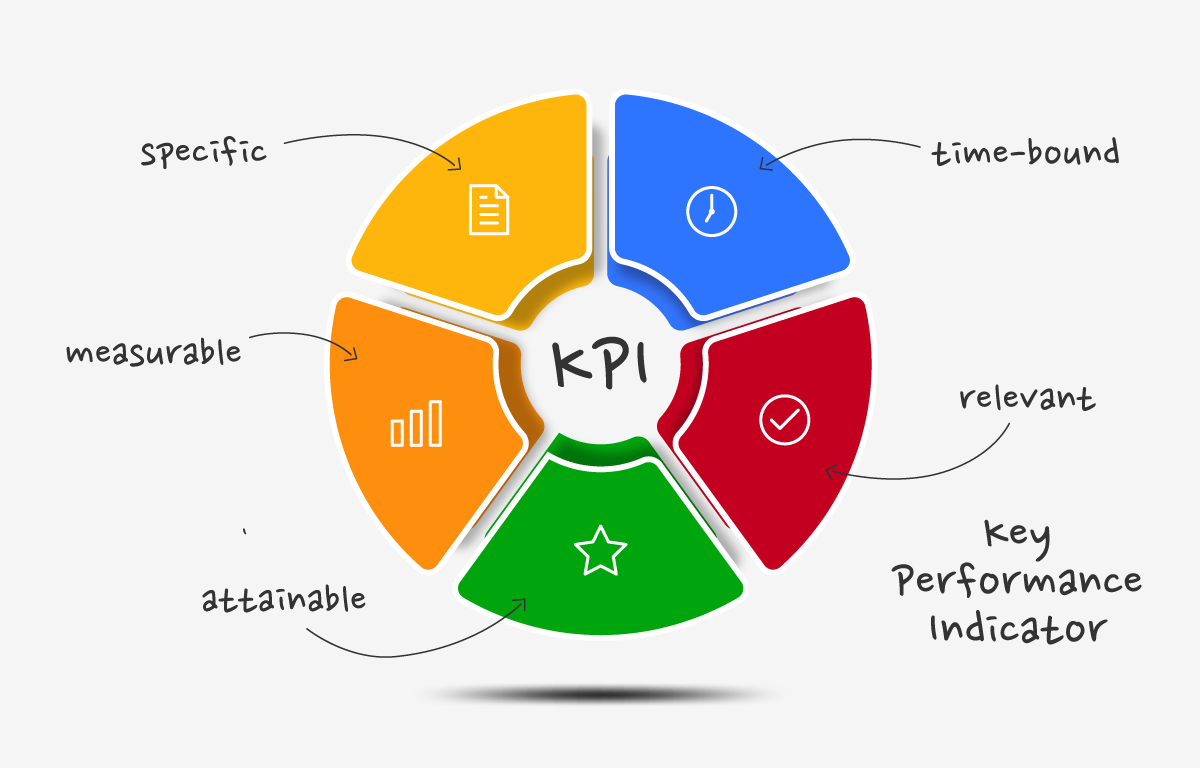
1.1 What Are KPIs in Mobile Marketing?
KPIs (Key Performance Indicators) are quantifiable measures that track progress toward specific marketing goals. In mobile marketing, KPIs vary based on campaign type and objectives. For example:
-
A mobile app marketer may track downloads, retention, and in-app purchases.
-
A mobile web advertiser focuses on click-through and conversion rates.
-
An SMS marketer measures delivery and redemption rates.
1.2 Why Mobile KPIs Are Unique
Unlike traditional digital marketing, mobile channels involve real-time interactions, location data, and app-based behavior. Metrics must account for:
-
User context (on-the-go usage)
-
Device constraints (screen size, connectivity)
-
Multi-touch journeys (cross-device attribution)
Hence, mobile KPIs often emphasize engagement quality, immediacy, and retention more than raw traffic numbers.
2. Core Categories of Mobile Marketing Metrics
Mobile marketing metrics fall into several main categories:
-
Acquisition Metrics: How effectively you attract new users.
-
Engagement Metrics: How users interact with your content or app.
-
Retention Metrics: How well you keep users coming back.
-
Monetization Metrics: How efficiently you generate revenue from mobile interactions.
-
Performance Metrics: How well your mobile platform performs technically.
Each category reveals unique insights about your campaign’s success and future opportunities.
3. Acquisition Metrics
Acquisition KPIs measure how effectively you’re bringing in new users through mobile channels.
3.1 App Downloads and Installs
This is the starting point for app marketers. A high download rate indicates effective promotion, but downloads alone don’t equal engagement. Always complement this metric with activation and retention data.
Formula:App Installs = Number of successful downloads from the app store
3.2 Cost Per Install (CPI)
CPI measures how much it costs to acquire one app user via paid campaigns. It’s critical for evaluating ROI from mobile ads.
Formula:CPI = Total Ad Spend ÷ Number of Installs
3.3 Click-Through Rate (CTR)
CTR measures how effectively your ad or message prompts clicks.
Formula:CTR = (Clicks ÷ Impressions) × 100
High CTRs suggest your creative and targeting are resonating with audiences.
3.4 Conversion Rate (CVR)
Tracks the percentage of users who complete a desired action after clicking on a mobile ad, email, or SMS.
Formula:CVR = (Conversions ÷ Clicks) × 100
Conversions could include purchases, form submissions, or downloads.
4. Engagement Metrics
Engagement KPIs evaluate how users interact with your mobile properties after acquisition. They reveal whether you’re providing value and maintaining attention.
4.1 Session Length
This measures the average duration of user sessions in your app or on your site.
Formula:Average Session Length = Total Duration of All Sessions ÷ Number of Sessions
Longer sessions typically indicate stronger engagement, but context matters — shorter sessions can still be valuable if users complete meaningful actions.
4.2 Session Frequency
Indicates how often users return to your app or site within a specific time period. Frequent sessions suggest high engagement and user satisfaction.
4.3 Screen Flow and Path Analysis
Shows how users navigate through your app or mobile site — where they enter, what screens they view, and where they drop off. It identifies friction points in user experience.
4.4 Push Notification Engagement Rate
Measures how effectively your push notifications encourage users to open and interact with your app.
Formula:Engagement Rate = (Push Opens ÷ Notifications Sent) × 100
5. Retention and Churn Metrics
Retention metrics determine whether users stick with your app or campaign over time. They are crucial for long-term profitability.
5.1 Retention Rate
The percentage of users who continue using your app after a specific period (e.g., 7, 30, or 90 days).
Formula:Retention Rate = (Users Active at End of Period ÷ Users Active at Start of Period) × 100
Retention rate reflects product value and user satisfaction. A high retention rate means users find your app indispensable.
5.2 Churn Rate
The opposite of retention, churn measures how many users stop engaging over a given time frame.
Formula:Churn Rate = (Users Lost ÷ Total Users at Start) × 100
Lower churn is ideal; a high churn rate signals poor user experience or weak value proposition.
5.3 Daily and Monthly Active Users (DAU/MAU)
DAU and MAU help track app stickiness. The DAU/MAU ratio indicates how often users return.
Formula:Stickiness = (DAU ÷ MAU) × 100
A 20–30% stickiness rate is typical; anything above 50% suggests strong user loyalty.
6. Monetization Metrics
For revenue-driven mobile marketers, monetization KPIs highlight financial performance.
6.1 Average Revenue Per User (ARPU)
ARPU measures how much revenue each user generates on average.
Formula:ARPU = Total Revenue ÷ Number of Active Users
This helps estimate profitability and guide pricing strategies.
6.2 Lifetime Value (LTV)
LTV predicts the total revenue a user will generate over their relationship with your app or brand.
Formula:LTV = (Average Purchase Value × Purchase Frequency × Customer Lifespan)
LTV helps determine how much you can spend on acquisition without losing money.
6.3 Return on Ad Spend (ROAS)
ROAS compares revenue earned from a campaign to the cost of running it.
Formula:ROAS = (Revenue from Campaign ÷ Cost of Campaign) × 100
A ROAS above 200% (2:1) is generally considered healthy in mobile advertising.
6.4 In-App Purchase Rate
The percentage of users who make at least one in-app purchase.
Formula:In-App Purchase Rate = (Purchasing Users ÷ Total Users) × 100
7. Technical and Performance Metrics
A slow, buggy, or unstable mobile experience can destroy engagement. Technical KPIs track how efficiently your app or site performs.
7.1 Load Time
Measures how long it takes for your app or mobile web page to load. Ideally, it should be under three seconds. Every extra second of load time reduces conversion potential.
7.2 Crash Rate
Tracks how often your app crashes during user sessions. High crash rates can severely damage retention and ratings.
Formula:Crash Rate = (Number of Crashes ÷ Total Sessions) × 100
7.3 App Store Ratings and Reviews
User-generated feedback provides qualitative insight into app quality, UX, and bugs. Monitor sentiment trends over time.
7.4 Network Latency
Latency measures the delay between a user’s action and the app’s response. Optimize APIs, images, and backend servers to minimize lag.
8. Attribution and Cross-Channel Measurement
Mobile users often move between channels — viewing an ad on Instagram, clicking an SMS link, or later converting through a mobile browser. Attribution metrics help assign credit for conversions.
8.1 First-Touch Attribution
Credits the first interaction (e.g., initial ad click) for the conversion.
8.2 Last-Touch Attribution
Credits the final interaction before the conversion event.
8.3 Multi-Touch Attribution
Distributes credit across multiple touchpoints in the customer journey for a holistic performance view.
Tools like Adjust, Appsflyer, and Google Analytics 4 (GA4) can track attribution across apps, ads, and websites.
9. SMS and Push Notification KPIs
SMS and push campaigns have unique metrics that highlight user engagement and timing effectiveness.
9.1 Delivery Rate
Percentage of successfully delivered messages out of total sent.
Formula:Delivery Rate = (Delivered ÷ Sent) × 100
9.2 Open Rate
For push notifications, this measures how many users opened the message.
9.3 Click-to-Action Rate
Tracks how many users tapped a link or completed an intended action from your SMS or push.
9.4 Opt-Out Rate
Monitors how many users unsubscribe from receiving future communications — a key indicator of over-messaging or irrelevant content.
10. Advanced Engagement Metrics
For mature mobile marketing operations, deeper behavioral metrics reveal the quality of engagement rather than just volume.
10.1 User Cohorts
Segment users based on acquisition source, behavior, or lifecycle stage. Cohort analysis helps uncover retention trends and content preferences.
10.2 Funnel Analysis
Examines the stages users go through before converting (e.g., App Open → Add to Cart → Checkout → Purchase). Identifying where drop-offs occur allows you to refine UX.
10.3 Heatmaps and Gesture Tracking
Visual tools like Hotjar or UXCam reveal how users scroll, swipe, and tap within your mobile site or app. They expose usability issues invisible in traditional analytics.
11. KPIs for Location-Based and Mobile Ad Campaigns
11.1 Impressions and Reach
Indicates how many unique users saw your ad or offer within a defined area.
11.2 Click-to-Visit Rate
In location-based campaigns, this tracks how many users clicked your ad and then visited a nearby store or location.
Formula:Click-to-Visit Rate = (Physical Visits ÷ Clicks) × 100
11.3 Store Conversion Rate
Shows the percentage of those visits that resulted in a purchase.
11.4 Cost Per Visit (CPV)
Useful for retail and hospitality industries, CPV evaluates efficiency of foot-traffic-driven campaigns.
12. How to Choose the Right KPIs
Selecting too many KPIs can dilute focus. Instead:
-
Align with business goals: Revenue growth, engagement, or brand awareness.
-
Map metrics to the customer journey: Awareness → Acquisition → Activation → Retention → Revenue.
-
Prioritize quality over quantity: Deep engagement and retention are more valuable than shallow reach.
-
Benchmark regularly: Compare performance over time and against industry averages.
13. Tools for Mobile KPI Tracking
To collect and analyze KPIs effectively, use specialized tools:
-
Google Analytics 4 (GA4): Unified app + web tracking.
-
Firebase Analytics: In-depth mobile app metrics.
-
Mixpanel: Behavioral analytics and funnel optimization.
-
Appsflyer / Adjust: Attribution tracking across channels.
-
Amplitude: Retention and cohort analytics.
-
Data.ai (formerly App Annie): Market benchmarking and app intelligence.
Integrating these tools ensures comprehensive visibility into every stage of the mobile marketing funnel.
14. Reporting and Interpreting Results
Metrics are only valuable when translated into insights. When building reports:
-
Highlight trends rather than isolated data points.
-
Use visual dashboards for clarity.
-
Include context and recommendations, not just numbers.
-
Share metrics across teams (marketing, product, UX) to foster collaboration.
15. Future of Mobile Marketing Measurement
The future of KPI tracking is shifting toward:
-
Privacy-first analytics: With stricter data laws (GDPR, CCPA) and Apple’s App Tracking Transparency (ATT), marketers must respect consent and transparency.
-
Predictive analytics: Machine learning models forecast LTV and churn risk.
-
Omnichannel integration: Metrics will unify across mobile, web, and physical channels for complete lifecycle insight.
-
Real-time dashboards: Instant insights will replace static monthly reports.
Conclusion
Mobile marketing success is built on precision, performance, and perspective. By tracking the right KPIs—ranging from app installs and engagement to retention and ROI—you can transform data into strategic decisions. The most effective mobile marketers don’t just measure activity; they measure impact.
Remember: Metrics should tell a story. They should reveal whether your mobile efforts are truly moving the needle for your business and your customers. The right KPIs illuminate not just where you are, but where to go next.
- Arts
- Business
- Computers
- Games
- Health
- Home
- Kids and Teens
- Money
- News
- Personal Development
- Recreation
- Regional
- Reference
- Science
- Shopping
- Society
- Sports
- Бизнес
- Деньги
- Дом
- Досуг
- Здоровье
- Игры
- Искусство
- Источники информации
- Компьютеры
- Личное развитие
- Наука
- Новости и СМИ
- Общество
- Покупки
- Спорт
- Страны и регионы
- World
