What Is Break-Even Analysis?
What Is Break-Even Analysis?
Break-even analysis is a fundamental financial tool used by businesses to understand when an activity becomes profitable. In simple terms, it answers one key question: How much do we need to sell to cover all our costs? The point at which total revenue equals total costs is called the break-even point. At this level, a business makes neither a profit nor a loss—it simply “breaks even.”
This concept is widely used by entrepreneurs, managers, and investors because it provides clear insight into cost structures, pricing decisions, and risk. Whether you are launching a startup, introducing a new product, or evaluating an existing operation, break-even analysis helps you make informed, practical decisions.
The Purpose of Break-Even Analysis
The main purpose of break-even analysis is to measure financial viability. It helps businesses:
-
Determine whether a product or service can be profitable
-
Understand the relationship between costs, price, and volume
-
Set sales targets and pricing strategies
-
Assess risk before making major decisions
-
Plan budgets and control costs
By showing how changes in costs or prices affect profitability, break-even analysis turns abstract financial data into actionable insight.
Key Concepts in Break-Even Analysis
To understand break-even analysis, you need to be familiar with three core components: fixed costs, variable costs, and revenue.
1. Fixed Costs
Fixed costs are expenses that do not change with the level of production or sales, at least in the short term. These costs must be paid regardless of how much the business produces.
Examples include:
-
Rent
-
Salaries of permanent staff
-
Insurance
-
Depreciation
-
Utilities with fixed charges
Because fixed costs remain constant, they play a major role in determining how high the break-even point will be.
2. Variable Costs
Variable costs change directly with the level of output or sales. The more you produce or sell, the higher these costs become.
Examples include:
-
Raw materials
-
Direct labor (hourly or per unit)
-
Packaging
-
Sales commissions
-
Shipping costs
Variable costs are often expressed on a per-unit basis, which makes them essential for break-even calculations.
3. Revenue
Revenue is the income generated from selling goods or services. It is calculated as:
Revenue = Price per unit × Number of units sold
Revenue increases as sales volume increases, eventually reaching the point where it equals total costs.
The Break-Even Point Explained
The break-even point (BEP) is the level of sales at which:
Total Revenue = Total Costs
At this point:
-
Profit = 0
-
Loss = 0
Sales above the break-even point result in profit, while sales below it result in a loss.
The break-even point can be expressed in:
-
Units sold, or
-
Sales value (currency)
The Break-Even Formula
Break-Even Point in Units
The most common formula is:
Break-even point (units) = Fixed Costs ÷ Contribution per Unit
Where:
Contribution per Unit = Selling Price per Unit − Variable Cost per Unit
The contribution per unit shows how much each unit sold contributes toward covering fixed costs and, eventually, generating profit.
Break-Even Point in Sales Value
Once you know the break-even point in units, you can calculate the break-even sales value:
Break-even sales = Break-even units × Selling price per unit
Alternatively, you can use the contribution margin ratio.
Contribution Margin and Its Importance
The contribution margin is a critical concept in break-even analysis. It represents the portion of sales revenue that contributes to covering fixed costs.
Contribution Margin per Unit
Selling price − Variable cost
Contribution Margin Ratio
Contribution margin ÷ Selling price
A higher contribution margin means:
-
Fixed costs are recovered faster
-
The break-even point is lower
-
Profit grows more quickly after break-even
Businesses often aim to increase contribution margin by raising prices, lowering variable costs, or improving efficiency.
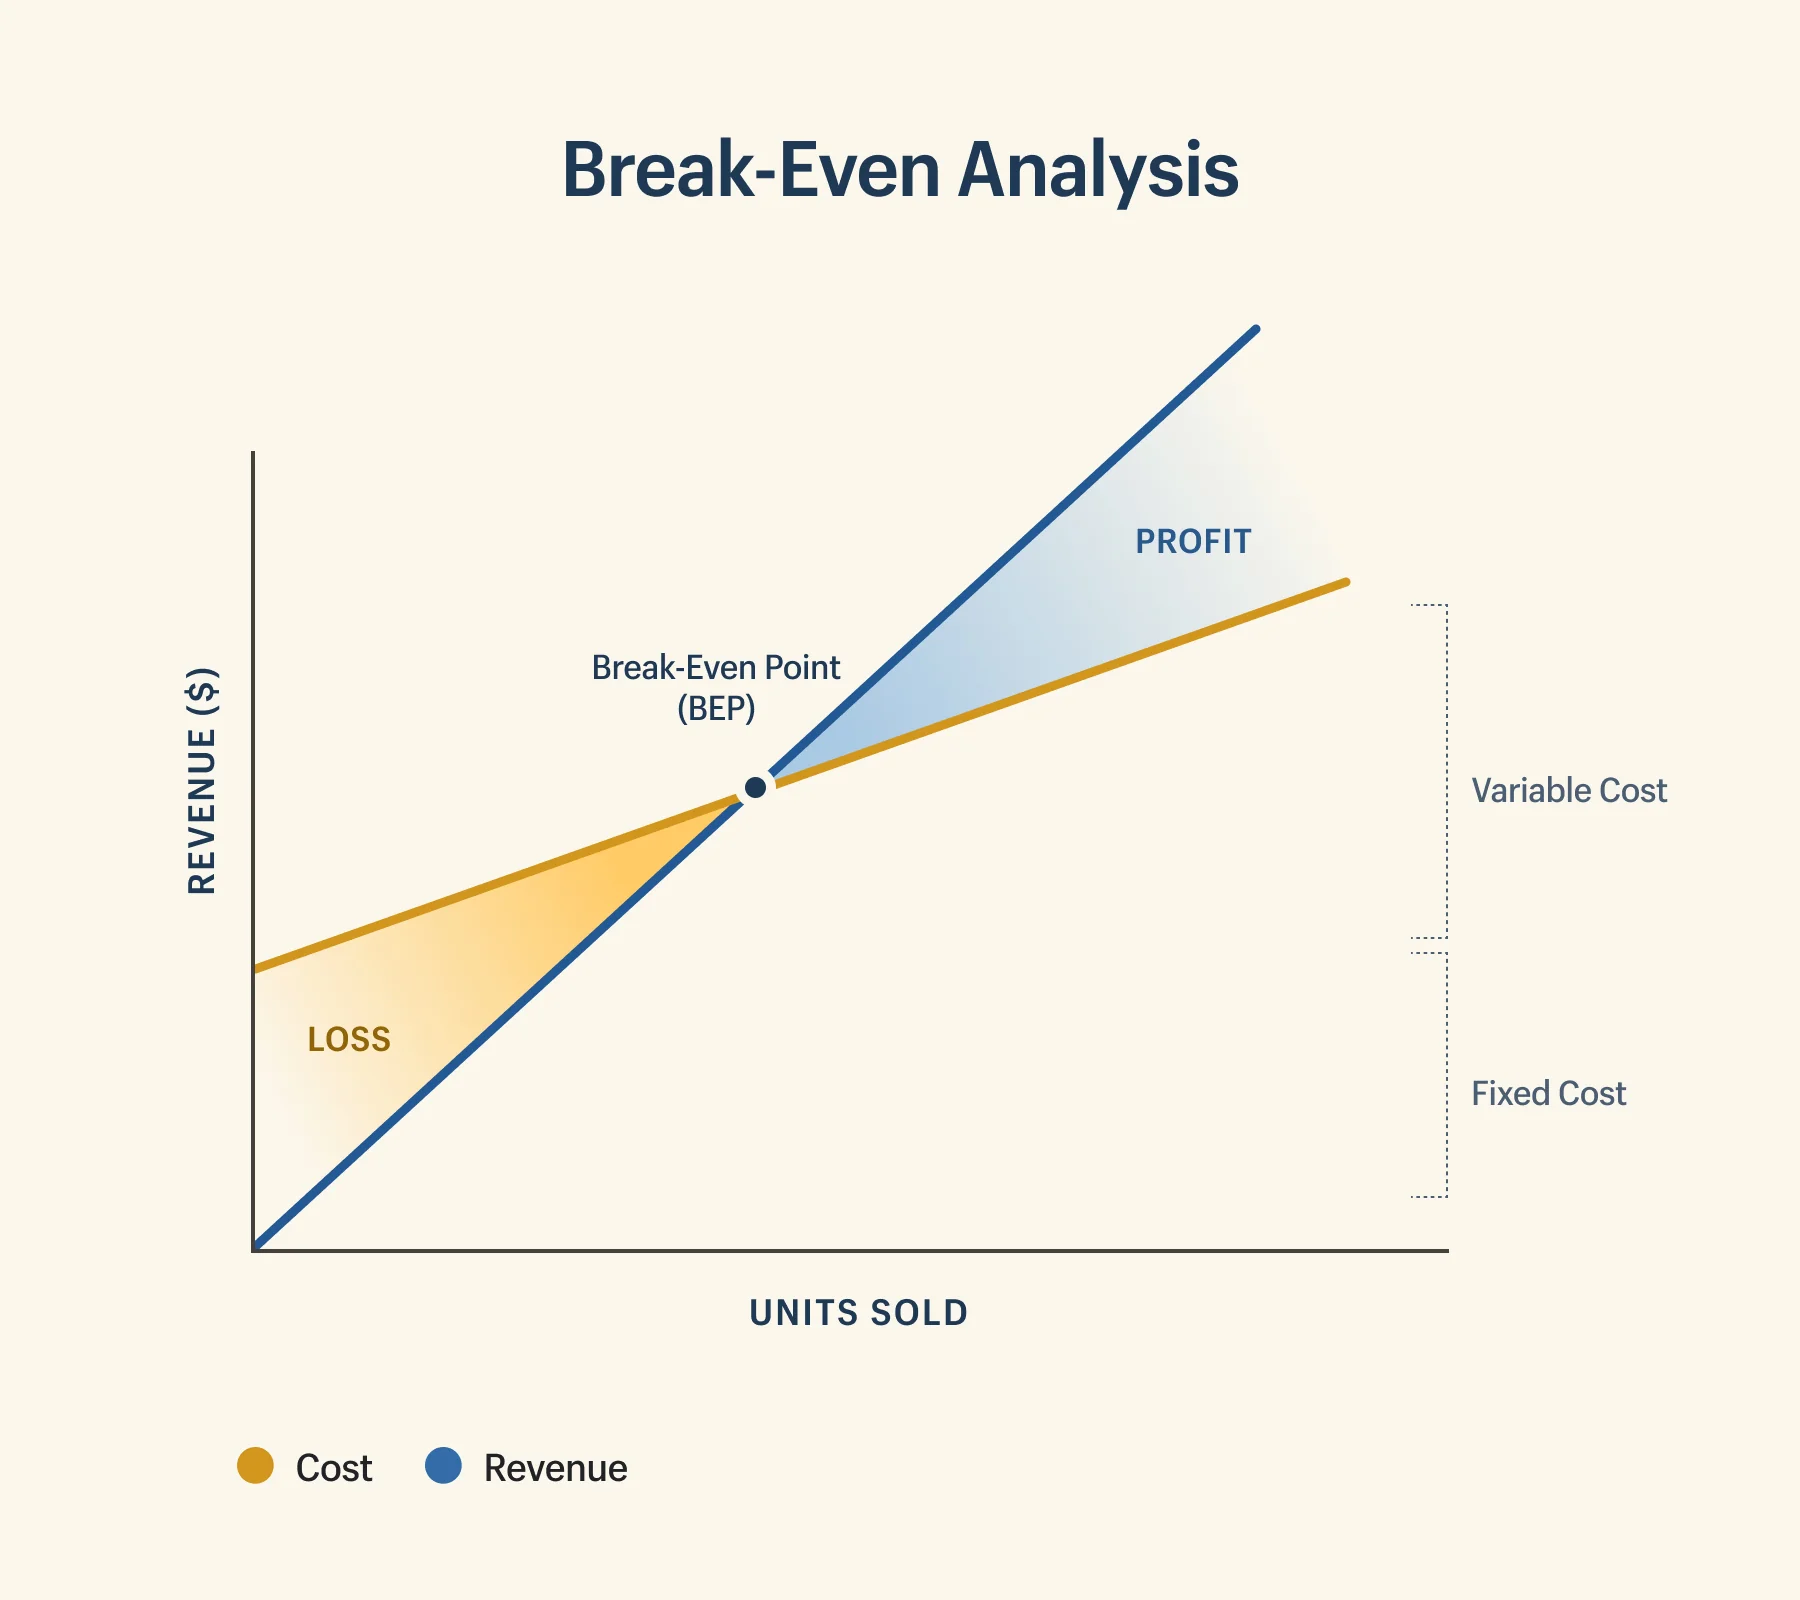
Graphical Representation of Break-Even Analysis
Break-even analysis is often illustrated using a break-even chart. This graph typically shows:
-
The horizontal axis (x-axis): Units sold or level of output
-
The vertical axis (y-axis): Costs and revenue
-
A fixed cost line (horizontal)
-
A total cost line (sloping upward)
-
A revenue line (sloping upward, usually steeper than total cost)
The point where the revenue line intersects the total cost line is the break-even point.
This visual representation makes it easier to understand how changes in volume affect costs and profits.
Why Break-Even Analysis Matters
1. Business Planning
For startups and new projects, break-even analysis helps determine whether an idea is financially feasible. If the break-even point is unrealistically high, the business model may need revision.
2. Pricing Decisions
Break-even analysis shows how price changes affect profitability. A small reduction in price can significantly increase the number of units required to break even.
3. Cost Control
By separating fixed and variable costs, managers can identify where cost reductions will have the greatest impact.
4. Sales Targets
It provides a clear minimum sales goal. Managers can set realistic targets that ensure costs are covered before focusing on profit.
5. Risk Assessment
A high break-even point indicates higher risk, as the business must achieve substantial sales before becoming profitable.
Break-Even Analysis in Different Contexts
Startups
Startups use break-even analysis to understand how long it will take to become profitable and how much funding they need to survive until then.
Manufacturing
Manufacturers rely on break-even analysis to decide production volumes, equipment purchases, and automation investments.
Service Businesses
Service firms use it to calculate billable hours, client volume, or project pricing required to cover operating costs.
New Products
When launching a new product, break-even analysis helps determine whether expected demand justifies development and marketing costs.
Margin of Safety
The margin of safety measures how much sales can drop before the business reaches the break-even point.
Margin of Safety = Actual Sales − Break-even Sales
A high margin of safety indicates financial stability, while a low margin suggests vulnerability to downturns or demand fluctuations.
Assumptions of Break-Even Analysis
While useful, break-even analysis is based on several assumptions:
-
Costs can be clearly divided into fixed and variable
-
Selling price per unit remains constant
-
Variable cost per unit remains constant
-
All units produced are sold
-
Efficiency and productivity do not change
These assumptions simplify reality, which means results should be interpreted carefully.
Limitations of Break-Even Analysis
Break-even analysis is a powerful tool, but it has limitations:
-
It oversimplifies real-world cost behavior
-
It ignores changes in market demand
-
It does not account for competition
-
It assumes linear relationships between costs and output
-
It focuses on short-term decisions
Because of these limitations, break-even analysis should be used alongside other financial and strategic tools.
Improving the Break-Even Position
Businesses can lower their break-even point by:
-
Reducing fixed costs (e.g., renegotiating rent)
-
Reducing variable costs (e.g., sourcing cheaper materials)
-
Increasing selling prices (if market allows)
-
Improving operational efficiency
-
Increasing contribution margin
Each of these actions reduces the sales volume needed to become profitable.
Break-Even Analysis vs. Profit Analysis
Break-even analysis focuses on when profit starts, not how much profit is made. Profit analysis goes further by examining:
-
Target profit levels
-
Profit planning
-
Sensitivity analysis
Once the break-even point is known, businesses can calculate how many additional units must be sold to achieve a desired profit.
Conclusion
Break-even analysis is one of the most practical and widely used tools in business finance. By identifying the point at which total revenue equals total costs, it gives managers and entrepreneurs a clear understanding of risk, cost structure, and sales requirements.
Although it relies on simplifying assumptions, break-even analysis remains invaluable for planning, pricing, and decision-making. When used correctly—and combined with other financial analyses—it helps businesses move from uncertainty to clarity, making it easier to plan for sustainable growth and long-term success.
- Arts
- Business
- Computers
- Игры
- Health
- Главная
- Kids and Teens
- Деньги
- News
- Personal Development
- Recreation
- Regional
- Reference
- Science
- Shopping
- Society
- Sports
- Бизнес
- Деньги
- Дом
- Досуг
- Здоровье
- Игры
- Искусство
- Источники информации
- Компьютеры
- Личное развитие
- Наука
- Новости и СМИ
- Общество
- Покупки
- Спорт
- Страны и регионы
- World
