
How Do I Monitor Applications on PaaS?
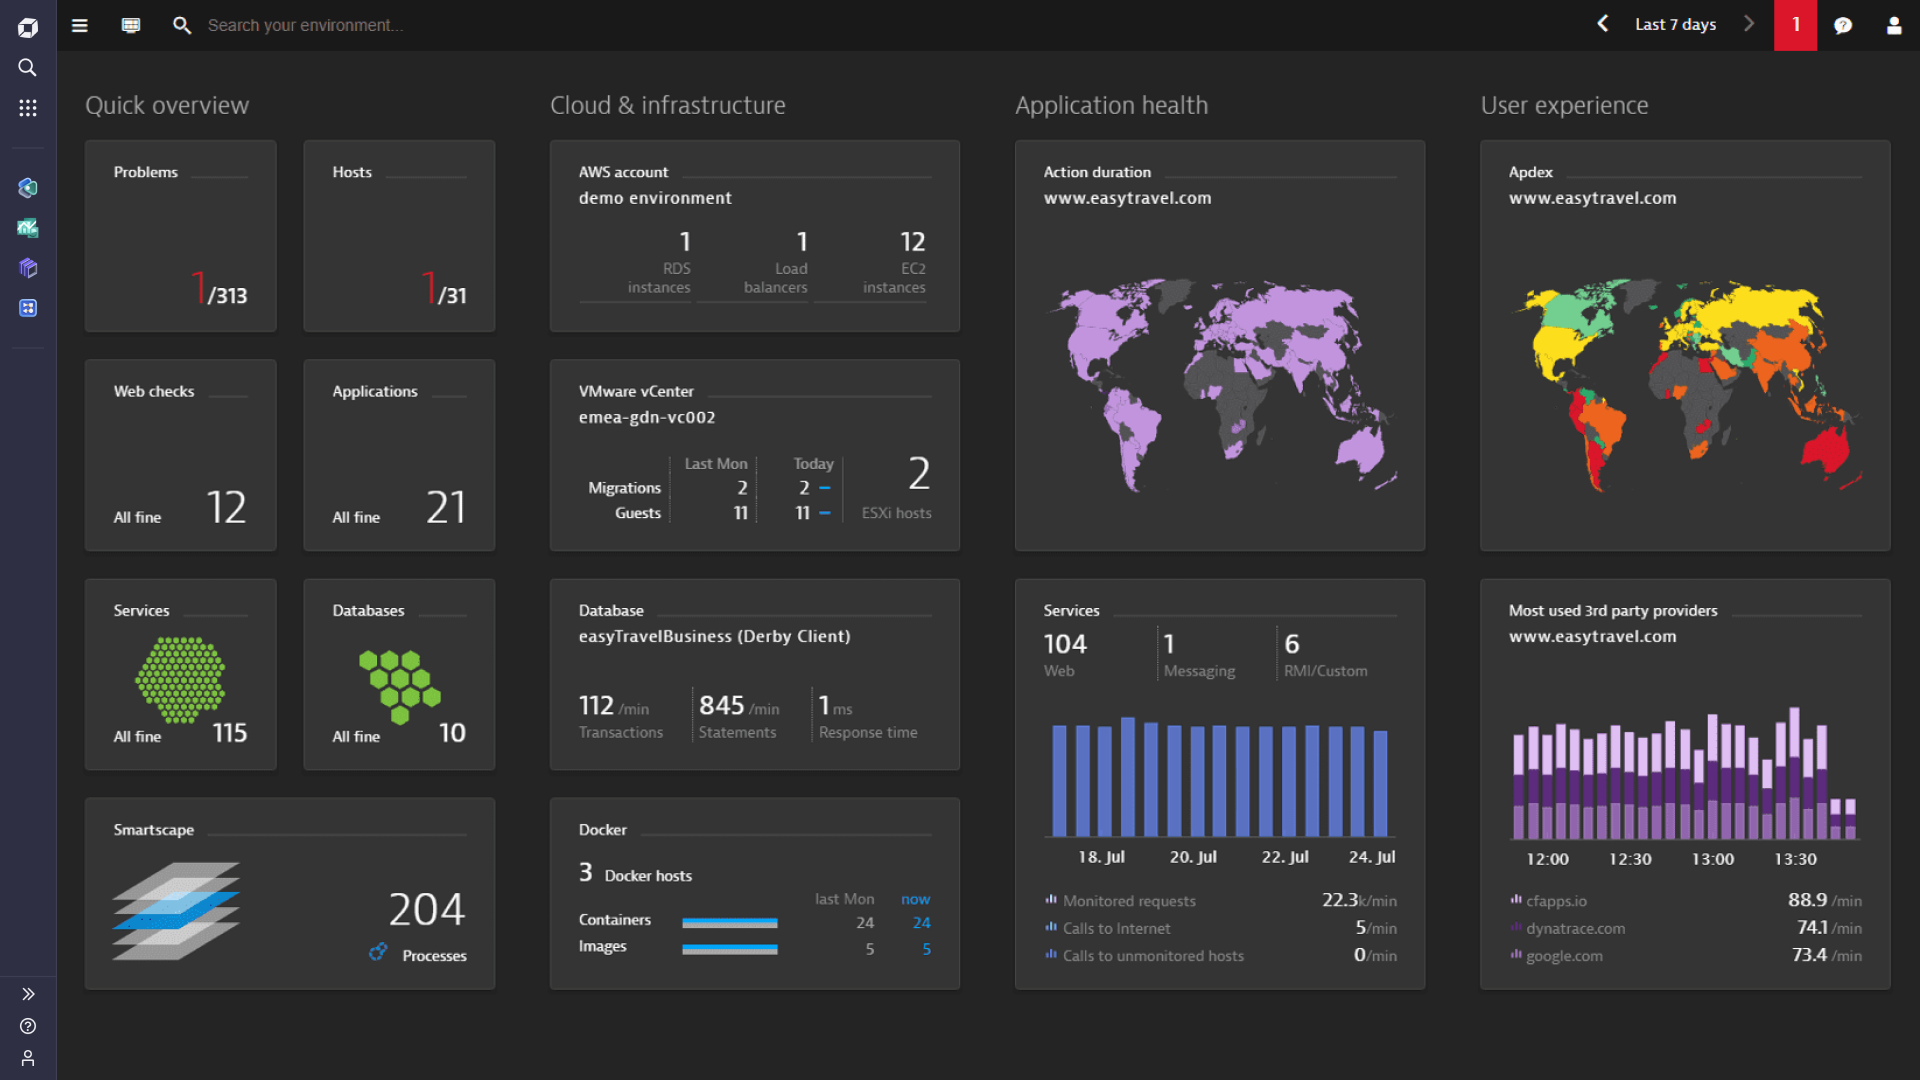
At 2:17 a.m., an alert appeared.
Not a catastrophic alert. Not the kind that immediately triggers a war room. Just a subtle notification indicating that response times had increased by 14%.
Most customers hadn't noticed.
Revenue hadn't declined.
The application was still online.
And yet, that small signal turned out to be the first visible symptom of a database bottleneck that would have eventually affected thousands of users.
What fascinated me wasn't the technical issue itself.
It was how quickly the team identified it.
A decade earlier, uncovering the root cause might have required digging through multiple servers, manually correlating logs, and assembling a timeline from fragmented data.
This time, the answer emerged within minutes.
The reason was simple.
The company had built a mature monitoring strategy around its Platform as a Service (PaaS) environment.
The experience reinforced something I continue to see across organizations of every size:
Applications rarely fail without warning.
The warning signs are usually there.
The challenge is knowing where to look.
That challenge becomes particularly interesting in a PaaS environment, where infrastructure management shifts to the platform provider, but application responsibility remains firmly in the hands of the organization.
Which raises an important question:
How do you effectively monitor applications when much of the infrastructure is no longer visible?
The answer begins by understanding what monitoring is actually trying to accomplish.
Monitoring Is Not About Watching Servers
Many teams approach monitoring as a technical exercise.
CPU utilization.
Memory consumption.
Disk activity.
Network throughput.
These metrics matter.
But they are not the primary objective.
Monitoring exists to answer a more fundamental question:
Is the application delivering the experience users expect?
That shift in perspective becomes especially important with PaaS.
Traditional infrastructure monitoring focuses heavily on server health because organizations manage those servers directly.
PaaS changes the equation.
The platform provider assumes responsibility for much of the underlying infrastructure.
Your responsibility moves upward.
Toward applications.
Toward services.
Toward customer outcomes.
The center of gravity changes.
The monitoring strategy must change with it.
What PaaS Actually Monitors for You
One reason organizations adopt PaaS is operational simplicity.
The platform automatically handles many infrastructure-level concerns.
Depending on the provider, built-in monitoring may include:
- Compute utilization
- Instance health
- Resource allocation
- Container status
- Platform availability
- Auto-scaling activity
- Runtime performance
This baseline visibility provides value.
But it is rarely sufficient.
Think of it as monitoring the building rather than monitoring the business operating inside the building.
A healthy server does not guarantee a healthy customer experience.
An application can technically function while simultaneously frustrating users.
The distinction matters.
Because customers experience applications, not infrastructure.
The Five Layers of Effective PaaS Monitoring
Organizations with strong observability practices rarely focus on a single metric category.
Instead, they build visibility across multiple layers.
Each layer tells part of the story.
Together, they create context.
1. Application Performance Monitoring (APM)
Application Performance Monitoring sits at the center of most modern monitoring strategies.
APM tools track:
- Response times
- Request throughput
- Error rates
- Dependency performance
- Transaction traces
- User interactions
This visibility allows teams to identify bottlenecks before they become customer-facing incidents.
The goal is not simply collecting data.
The goal is understanding behavior.
When response times increase, teams should know why.
Not hours later.
Ideally, immediately.
2. Log Monitoring
Logs remain one of the richest sources of operational intelligence.
Applications generate a constant stream of information:
- Errors
- Warnings
- User actions
- Authentication events
- Integration activity
PaaS platforms typically provide centralized logging capabilities or integrations with external log management systems.
The challenge isn't generating logs.
Most organizations generate more logs than they can reasonably analyze.
The challenge is extracting meaningful patterns.
Signal matters more than volume.
3. Infrastructure Metrics
Even though PaaS abstracts infrastructure, infrastructure metrics still matter.
Applications consume resources.
Resource constraints influence performance.
Useful metrics often include:
- CPU utilization
- Memory consumption
- Network activity
- Container utilization
- Storage performance
The difference is that teams monitor these metrics primarily to understand application behavior rather than infrastructure management itself.
The focus remains customer-facing outcomes.
4. User Experience Monitoring
This category receives surprisingly little attention.
Which is unfortunate.
Because user experience often reveals problems before infrastructure metrics do.
Real User Monitoring (RUM) measures:
- Page load times
- Front-end performance
- Geographic latency
- Browser-specific issues
- Session behavior
An application can appear healthy from the server perspective while delivering a poor user experience.
Monitoring should reflect reality as customers experience it.
Not merely as systems report it.
5. Business Metrics
This layer is frequently overlooked.
And yet it may be the most important.
Business metrics answer questions such as:
- Are transactions completing?
- Are customers converting?
- Are subscriptions processing?
- Are users completing workflows?
Technical metrics reveal system behavior.
Business metrics reveal organizational impact.
The strongest monitoring strategies connect both.
Popular Monitoring Tools for PaaS Environments
Most organizations combine native platform capabilities with specialized monitoring tools.
Each serves a distinct purpose.
| Monitoring Tool | Primary Focus | Strengths | Best Use Case |
|---|---|---|---|
| New Relic | Full-stack observability | Deep application insights | Enterprise monitoring |
| Datadog | Infrastructure and applications | Unified dashboards | Hybrid environments |
| Dynatrace | AI-driven observability | Automated root cause analysis | Large-scale systems |
| AppDynamics | Application performance | Business transaction tracking | Enterprise applications |
| Grafana | Visualization and analytics | Flexible dashboards | Custom monitoring |
| Prometheus | Metrics collection | Open-source ecosystem | Cloud-native workloads |
| Azure Monitor | Native Azure visibility | Platform integration | Azure-based PaaS |
| Google Cloud Monitoring | Cloud observability | Google ecosystem integration | GCP environments |
A pattern emerges.
Organizations rarely rely on a single source of truth.
Visibility comes from connecting multiple perspectives.
The Monitoring Mistake That Almost Everyone Makes
I learned this lesson the hard way.
Several years ago, I worked with a team that invested heavily in dashboards.
Every metric imaginable appeared on large displays.
CPU.
Memory.
Requests.
Containers.
Latency.
Thousands of data points updated continuously.
The dashboards looked impressive.
Executives loved them.
Visitors were impressed.
The monitoring strategy, however, was surprisingly ineffective.
When incidents occurred, engineers still struggled to determine root causes quickly.
The problem wasn't lack of data.
The problem was lack of context.
The organization had optimized for visibility rather than insight.
Eventually, the team simplified its approach.
Instead of tracking everything, they focused on a smaller set of metrics tied directly to customer experience and business outcomes.
Incident response improved dramatically.
The lesson stayed with me.
More monitoring is not necessarily better monitoring.
The goal isn't surveillance.
The goal is understanding.
Setting Meaningful Alerts
Alerts deserve special attention.
Because poorly designed alerts create their own operational problems.
Too few alerts and teams miss important issues.
Too many alerts and teams stop paying attention.
Alert fatigue is real.
Effective alerts share several characteristics:
Actionable
Every alert should trigger a potential action.
If no action exists, the alert may not be necessary.
Relevant
Not every anomaly requires immediate intervention.
Prioritization matters.
Contextual
Alerts should provide enough information to begin investigation quickly.
An alert without context often creates unnecessary delays.
Customer-Oriented
Where possible, alerts should connect technical conditions to customer impact.
This alignment improves decision-making during incidents.
Observability Versus Monitoring
The distinction matters.
Monitoring tells you that something happened.
Observability helps explain why.
PaaS environments increasingly benefit from observability practices because abstraction reduces direct visibility into infrastructure components.
Teams need richer context.
Modern observability often includes:
- Metrics
- Logs
- Distributed traces
- Event correlation
- Dependency mapping
Together, these elements create a more complete understanding of application behavior.
Think of monitoring as identifying symptoms.
Observability helps diagnose causes.
Organizations need both.
How PaaS Changes Incident Response
One fascinating side effect of PaaS adoption is how incident management evolves.
Traditional environments often require infrastructure investigation first.
Teams examine servers.
Operating systems.
Network components.
Hardware constraints.
PaaS environments frequently reverse this sequence.
Investigation starts at the application layer.
Teams focus on:
- Code changes
- Service dependencies
- Database interactions
- Configuration updates
- User behavior patterns
This shift accelerates resolution in many scenarios because the search space becomes smaller.
The platform absorbs much of the infrastructure complexity.
Monitoring strategies should reflect this new reality.
Building a Practical PaaS Monitoring Framework
Organizations often overcomplicate monitoring initiatives.
A practical framework is surprisingly straightforward.
Monitor:
- Availability
- Performance
- Errors
- User experience
- Business outcomes
Then connect these layers through centralized dashboards and intelligent alerting.
That's where the real value emerges.
Not from individual metrics.
From relationships between metrics.
Patterns reveal insights.
Context reveals priorities.
Conclusion: The Most Dangerous Application Is the One That Appears Healthy
When people think about monitoring, they often imagine failure.
Downtime.
Outages.
System crashes.
Those events matter.
But the most dangerous applications are not necessarily the ones that fail visibly.
They're the ones that degrade quietly.
The checkout flow that becomes slightly slower every week.
The API that introduces intermittent latency.
The authentication process that frustrates users just enough to reduce engagement.
These problems rarely announce themselves dramatically.
They emerge gradually.
Monitoring exists to surface those signals before customers begin voting with their behavior.
PaaS simplifies infrastructure management, but it does not eliminate the need for visibility. In some ways, abstraction makes visibility even more valuable.
Because when you no longer manage every layer directly, understanding application behavior becomes your most important operational capability.
The strongest organizations recognize this.
They don't monitor because something is broken.
They monitor because understanding systems is ultimately the foundation of improving them.
And in a world increasingly built on software, the organizations that understand their applications best often understand their customers best as well.
- Arts
- Business
- Computers
- Jeux
- Health
- Domicile
- Kids and Teens
- Argent
- News
- Personal Development
- Recreation
- Regional
- Reference
- Science
- Shopping
- Society
- Sports
- Бизнес
- Деньги
- Дом
- Досуг
- Здоровье
- Игры
- Искусство
- Источники информации
- Компьютеры
- Личное развитие
- Наука
- Новости и СМИ
- Общество
- Покупки
- Спорт
- Страны и регионы
- World

 English
 Russian
 Spanish
 Portuguese
 Deutsch
 Turkish
 Dutch
Dutch
 Italiano
 Arabic
 Romaian
 Portuguese (Brazil)
 Greek
Greek