
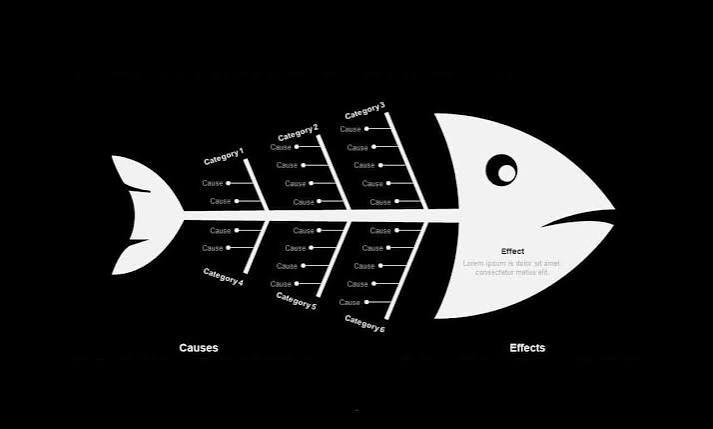
What is a fishbone (Ishikawa) diagram?
The Engine That Refused to Speak
Twelve years ago, a prominent commercial aviation maintenance facility in Seattle faced a terrifying operational crisis that grounded an entire regional fleet. Aircraft coming out of routine safety checks were repeatedly failing secondary hydraulic pressure tests within hours of returning to service. The facility’s executive vice president was frantic. Federal regulators were circling, airline clients were threatening catastrophic breach-of-contract lawsuits, and the hangar floor was a chaotic theater of blame and exhaustion.
The management team did what conventional bureaucracies always do under siege. They rushed headlong into solution mode.
They called in elite aerospace engineering consultants. They brought in high-precision digital pressure gauges, industrial ultrasonic flaw detectors, and automated valve test benches. For seventy-two hours, the hangar echoed with the deafening shriek of hydraulic stress tests and the frantic clatter of toolboxes. Workers tore apart actuator assemblies, replaced entire manifold blocks, and swapped out hydraulic pumps on every grounded aircraft. They were entirely convinced they had correctly identified the core mechanics of troubleshooting: find the broken part, replace it with brute tactical force, and move on.
Then, a veteran quality assurance inspector walked past the screaming test rigs, looked at the sprawling pile of discarded hardware, and asked a profoundly irritating question.
He did not ask how fast the replacement pumps could be bolted into place. He did not ask about alloy specifications or vendor warranties. Instead, he asked: "Why are all these hydraulic failures occurring exclusively on aircraft serviced during the Thursday night shift?"
When they actually investigated the operational habits of the Thursday night crew, the answer revealed a staggering institutional absurdity. The hydraulic pumps weren't failing due to manufacturing defects or material wear.
The root cause was entirely procedural and environmental. On Thursday nights, the facility's night-shift supervisor—in an effort to accommodate a rushed maintenance window—allowed technicians to use a non-standard solvent wash for cleaning valve seats. That specific solvent left a microscopic chemical residue that degraded internal O-rings, causing pressure leaks forty-eight hours later. The hardware was completely pristine. But the crisis had exposed a profound, uncomfortable truth about how organizations diagnose systemic failure.
This is the hidden trap of modern troubleshooting. We treat every visible symptom as the definitive problem, applying high-speed tactical force to the wrong layer of a system while the actual root cause remains blissfully untouched. Enter one of the most powerful visualization tools in the arsenal of industrial diagnosis: the fishbone diagram, also known as the Ishikawa diagram.
The Epidemic of Linear Panic and Visual Blindness
Look at your own professional calendar this week. How many hours did you spend rushing headfirst into execution? You likely built slide decks, patched software bugs, mediated team friction points, and answered urgent emails, entirely convinced you were being productive. But did you ever pause to ask whether you were fixing the underlying engine or merely wiping away the smoke?
We suffer from a deeply ingrained cultural pathology known as solution bias, compounded by our obsession with linear firefighting. From our earliest days in school through our rise up the corporate hierarchy, our environments train us to react instantly to whatever is flashing red. The customer yells, so we offer a refund. The metric drops, so we launch a campaign. The employee burns out, so we mandate a wellness seminar.
We treat troubleshooting as an athletic race to make the noise stop.
This creates a dangerous illusion of competence. We become exceptionally skilled at executing superficial fixes with surgical precision, ensuring that the exact same problem will return with absolute mathematical certainty next quarter.
Consider how most organizations handle a chronic dip in employee retention or a recurring software deployment failure. Within minutes of reviewing the metrics, emergency committees form. Spreadsheets open. People begin aggressively debating policy updates, patch releases, and managerial oversight. Everyone is intensely active, highly focused, and utterly convinced they are doing vital, high-leverage work.
Yet, if you interrupt them mid-debate and ask, "What are all the potential systemic categories driving this recurring failure?" you will often watch the room disintegrate into nervous silence or defensive posturing. One executive thinks the problem is compensation. Another thinks it is the project management software. A third is convinced it is macroeconomic pressure. They are all furiously treating symptoms because they lack a structured canvas like the fishbone diagram to map reality.
If you cannot visualize the multi-dimensional root causes of a problem, your intelligence and your work ethic become weapons of self-destruction. The harder you work on treating a symptom, the deeper you embed the systemic disease.
Anatomy of the Divergence: Linear Panic vs. Fishbone Mastery
To understand why the fishbone diagram is so powerful yet so frequently misunderstood, we have to look past vague corporate buzzwords and examine the concrete behavioral mechanics of how we diagnose friction. Here is how superficial symptom-chasing compares to disciplined fishbone analysis across various operational frameworks:
| Diagnostic Dimension | Superficial Symptom-Chasing (The Panic Loop) | Disciplined Fishbone Analysis (Systemic Mapping) | Cognitive Cost & Organizational Impact |
| Initial Reaction | Reacting instantly to the loudest complaint, the most visible error, or the flashing dashboard metric. | Enforcing a deliberate diagnostic pause to map out all potential categories of failure before taking action. | High initial friction, low long-term drag. Eliminates recurring fires entirely. |
| Data Gathering | Relying on surface-level feedback, direct customer anger, or immediate post-mortem assumptions. | Actively collecting cross-functional data across machinery, methods, materials, measurements, and personnel. | Requires intellectual humility. Exposes uncomfortable organizational truths. |
| Action Strategy | Applying tactical Band-Aids: policy mandates, hurried patches, cosmetic redesigns, or temporary bonuses. | Reengineering structural incentives, removing systemic bottlenecks, or redesigning operational architecture. | Demands upfront capital and courage. Creates permanent, self-sustaining stability. |
| Long-Term Result | The exact same crisis recurs in a slightly different disguise three to six months later. | The vulnerability is permanently closed, freeing up cognitive bandwidth for genuine innovation. | Transforms organizational culture. Shifts teams from reactive firefighters to proactive architects. |
Notice the structural divide in the table above. Symptom-chasing relies entirely on speed, motion, and brute-force execution. The fishbone diagram relies on pause, perspective, and structured categorization. When organizational complexity scales upward, the superficial method collapses into a repeating loop of expensive, exhausting fire drills.
A Lesson from My Own Blind Spots
I learned this reality the hard way several years ago while leading a product strategy overhaul for a fast-growing enterprise software firm. Our customer support queue was overflowing, and our net promoter scores were plummeting into negative territory. The executive leadership team was in a state of full-blown panic.
My initial reaction was textbook symptom-chasing. I looked at the support ticket backlog and immediately defined the problem: Our support team is understaffed and overwhelmed.
I argued that we needed to hire ten new support engineers immediately, implement a 24/7 chatbot, and mandate stricter response-time SLAs. I spent two weeks drafting hiring requisitions, budgeting vendor contracts, and restructuring support shifts. I was entirely confident. I had quantitative data showing that customers were waiting forty-eight hours for a response. Case closed.
Fortunately, before we pushed the new hiring plan through the finance committee, a senior data analyst on my team insisted we step back, grab a whiteboard marker, and draw a proper fishbone diagram.
What we discovered shattered my elegant, expensive staffing solution entirely:
-
Head (The Problem): Enterprise customer support queue overflowing with ticket backlogs.
-
Bone 1 (People): Support staff lacked specialized training on legacy database migrations.
-
Bone 2 (Methods): Documentation for handling custom API tokens was outdated and ambiguous.
-
Bone 3 (Machines): Customer staging environments suffered from recurring memory leaks.
-
Bone 4 (Materials): Third-party authentication APIs experienced intermittent rate-limiting failures.
-
Bone 5 (Measurements): Internal KPIs rewarded agents for closing tickets quickly rather than resolving root issues.
The support tickets weren't pouring in because we lacked enough humans to answer questions. They were pouring in because of a multi-dimensional failure spanning outdated documentation, unoptimized staging hardware, volatile third-party APIs, and perverse internal metrics.
If we had deployed my "hiring and chatbots" solution, we would have successfully spent hundreds of thousands of dollars bringing in new support staff to manually apologize for a broken software ecosystem, while completely ignoring the structural rot causing the hemorrhage.
I sat at my desk staring at the whiteboard sketch, internalizing a brutal professional truth. Root causes are never found in a single linear chain. They are distributed across the entire anatomy of the operating system.
How to Construct and Utilize a Fishbone Diagram Without Falling Into Common Traps
Invented by industrial quality control pioneer Kaoru Ishikawa in the 1960s, the fishbone diagram is designed to visually unpack the root causes of a problem by categorizing potential sources of failure. Yet, in practice, teams routinely butcher the technique, turning it into a chaotic brainstorming session filled with random sticky notes and wishful thinking.
Mastering the fishbone diagram requires adhering to four rigorous execution principles.
1. Define the Problem Head First (Avoid Vague Statements)
The most common failure mode in fishbone facilitation is writing a vague, emotional problem statement on the fish's head, such as "Our product sucks" or "Sales are bad."
-
The Practice: Formulate the problem statement with surgical precision. Specify what is happening, where it is happening, when it occurs, and the magnitude of the impact.
-
The Nuance: A precise problem statement ("Enterprise database syncs fail during bi-weekly releases on staging servers") instantly points toward relevant diagnostic categories.
2. Utilize Standard Categories as Diagnostic Lenses (The 6Ms)
When staring at a blank fishbone spine, teams often struggle to figure out where to place branches. Ishikawa originally proposed standard manufacturing categories known as the 6Ms, which can be adapted for any industry:
-
Manpower / Personnel: Are people properly trained? Are fatigue or incentives driving errors?
-
Methods: Are standard operating procedures clear, outdated, or ignored?
-
Machines / Equipment: Are hardware tools, software systems, or servers functioning correctly?
-
Materials: Are raw inputs, data feeds, or documentation accurate and high-quality?
-
Measurement: Are metrics, KPIs, and sensors tracking the right indicators?
-
Milieu / Mother Nature: How do environmental, market, or external factors influence the outcome?
-
The Nuance: Do not treat these categories as rigid boxes; treat them as cognitive prompts to force your brain into unfamiliar corners of the system.
3. Drill Down to Sub-Causes (The Bones Beneath the Bones)
A superficial fishbone diagram stops at primary categories, listing general complaints like "bad training" or "slow software." A true diagnostic fishbone drills down into secondary and tertiary sub-causes.
-
The Practice: For every major cause listed on a primary bone, ask "Why does that occur?" and draw a smaller sub-bone branching off it, effectively combining the fishbone structure with the 5 Whys methodology.
-
The Nuance: The real root cause is almost never found on the main spine; it is hiding at the frayed tip of a minor sub-bone.
4. Verify with Empirical Data, Not Voting (Avoid Opinion Bias)
In many corporate workshops, a fishbone session devolves into a political shouting match where the most senior person in the room votes on which bone looks most appealing.
-
The Practice: Treat every item placed on the fishbone diagram as an unverified hypothesis. Before committing capital to fix a specific bone, mandate empirical data collection to prove that the suspected root cause actually exists in the wild.
-
The Nuance: A fishbone diagram is an investigative map, not a ballot box. Use it to guide your research, not to bypass it.
The Provocative Reality of the Fishbone Diagram
Let us dismantle the ultimate comforting illusion in modern professional culture: the belief that leadership and problem-solving are simply matters of working harder, staying later, and fighting fires with relentless physical energy.
When organizations face complex, messy operational crises, they love to praise the frantic executives who rush in, deploy emergency resources, and bark orders during a fire drill. They cast those individuals as heroic leaders. That is a dangerous, systemic delusion. It is a psychological defense mechanism designed to protect us from the highly uncomfortable, ambiguous labor of sitting in silence, mapping systemic dependencies, and admitting that our own organizational designs are flawed.
Mastering the fishbone diagram requires immense restraint. It requires intellectual courage, the discipline to stop fighting fires long enough to inspect the architectural wiring, and the brutal honesty of looking at your own sloppy diagnostic habits without making excuses.
If your home is flooding because a pipe is broken, mopping the floor faster will never save your furniture. Yelling at the water will not change its physics. You have to turn off the main valve.
It is time to turn off the main valve. Stop treating problem-solving as a frantic reaction to the loudest symptoms in the room. Stop hoping that brute-force execution will somehow mask a structural vulnerability. Build the diagnostic maps, master the art of multi-dimensional tracing, and take absolute ownership of your intellectual output. Watch how quickly your professional trajectory transforms when you stop wiping away smoke and start extinguishing the fire at its source through disciplined application of the fishbone diagram.
- Arts
- Business
- Computers
- Jeux
- Health
- Domicile
- Kids and Teens
- Argent
- News
- Personal Development
- Recreation
- Regional
- Reference
- Science
- Shopping
- Society
- Sports
- Бизнес
- Деньги
- Дом
- Досуг
- Здоровье
- Игры
- Искусство
- Источники информации
- Компьютеры
- Личное развитие
- Наука
- Новости и СМИ
- Общество
- Покупки
- Спорт
- Страны и регионы
- World

 English
 Russian
 Spanish
 Portuguese
 Deutsch
 Turkish
 Dutch
Dutch
 Italiano
 Arabic
 Romaian
 Portuguese (Brazil)
 Greek
Greek